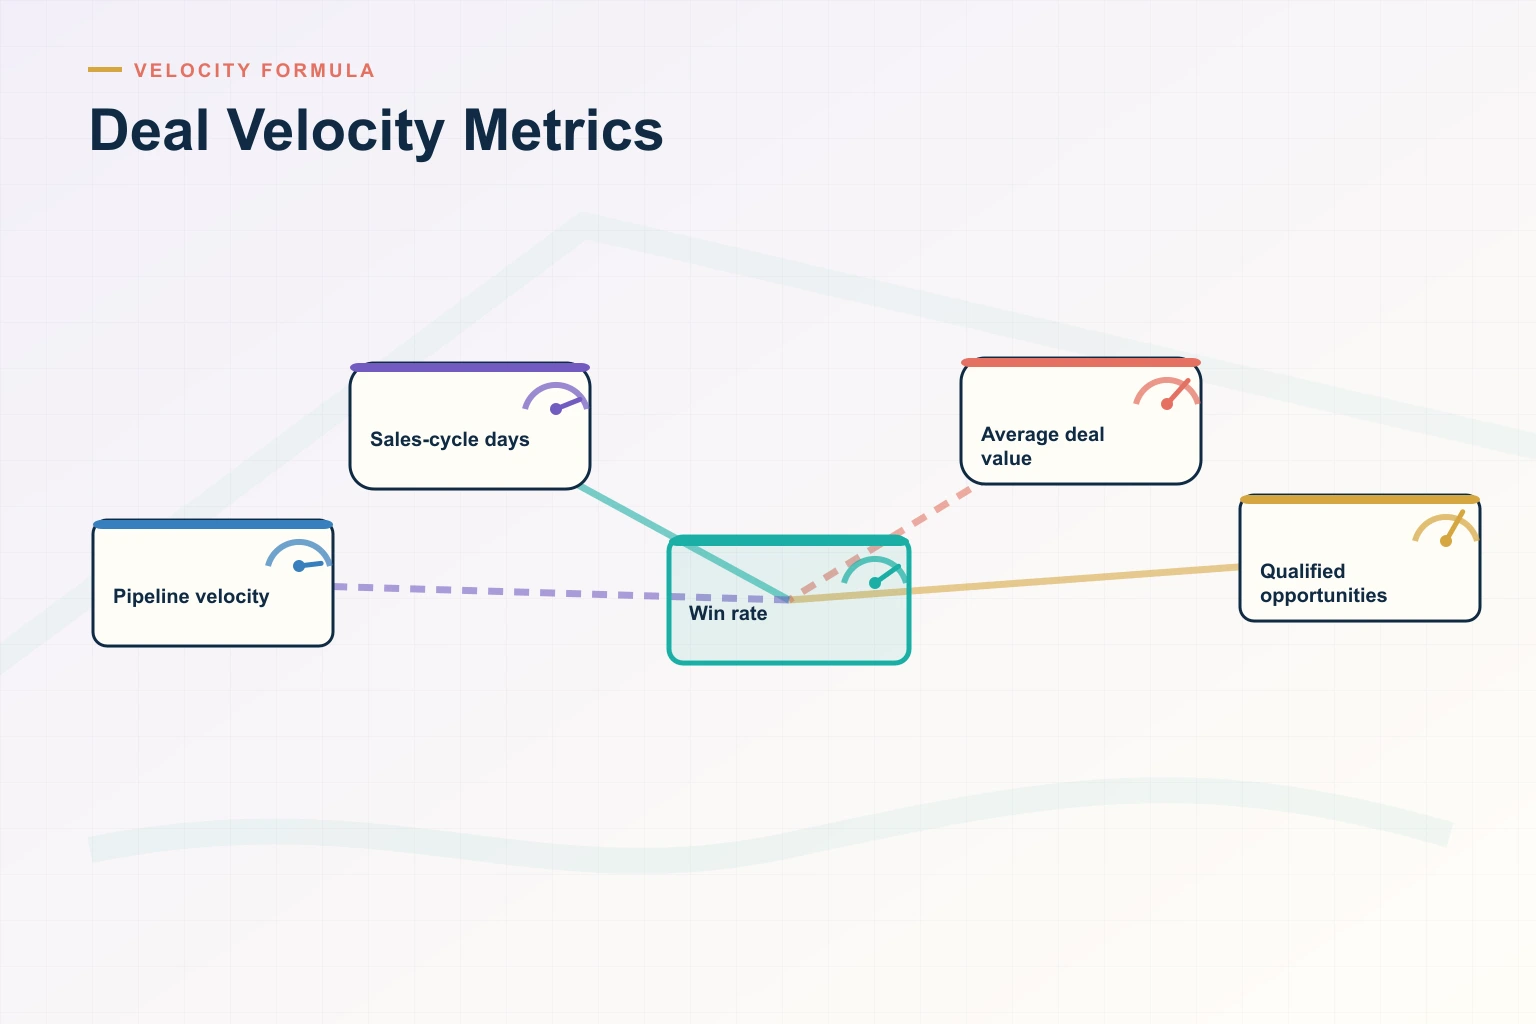
Deal velocity is how fast your pipeline turns into revenue. It is usually measured with the sales velocity formula: qualified opportunities × win rate × average deal size ÷ average sales cycle length in days. The result is revenue per day, and each of the four inputs is a lever you can measure and improve.
This guide works through the formula with a hypothetical example, explains how to measure each lever, shows where velocity and win rate pull against each other, summarizes what published research says slows enterprise deals, lists benchmarks only from named sources, and explains how AI and deal signals help, within limits.
Last updated: 16 October 2026
What is deal velocity?
Revenue teams use “deal velocity” in two related ways:
- Sales velocity (pipeline level): the revenue your pipeline produces per day, calculated with the formula below. It tells leaders which of four levers is holding revenue back.
- Deal velocity (deal level): how quickly one opportunity moves from stage to stage, measured as days in each stage and total days to close. It tells managers which deals are stuck and where.
You need both. The pipeline figure points to the constraint (too few opportunities, a falling win rate, shrinking deals or longer cycles); stage timing shows which deals and which stages cause it. “Pipeline velocity” is often used as a synonym for sales velocity; our pipeline velocity guide covers pipeline management practices in more depth.
What is the sales velocity formula?
Sales velocity = (number of qualified opportunities × win rate × average deal size) ÷ average sales cycle length in days
Salesforce defines the formula the same way in its guide to sales velocity (12 March 2024): opportunities are the qualified leads in your pipeline during the period, deal value is average revenue per new customer, win rate is the share of opportunities that became customers, and cycle length is the average number of days from qualified lead to paying customer.
Worked example (hypothetical numbers)
The figures below are invented for illustration and do not describe any real company. A mid-market team has 150 qualified opportunities in a quarter, a 20% win rate, a $25,000 average deal and a 90-day average sales cycle:
(150 × 0.20 × $25,000) ÷ 90 = $750,000 ÷ 90 = $8,333 of revenue per day, or about $750,000 over a 90-day quarter.
Now improve each lever by 10% on its own, then all four together:
| Scenario (hypothetical) | Qualified opportunities | Win rate | Average deal size | Cycle length (days) | Velocity per day | Change |
|---|---|---|---|---|---|---|
| Baseline | 150 | 20% | $25,000 | 90 | $8,333 | none |
| 10% more opportunities | 165 | 20% | $25,000 | 90 | $9,167 | +10.0% |
| Win rate up by a tenth | 150 | 22% | $25,000 | 90 | $9,167 | +10.0% |
| Deals 10% larger | 150 | 20% | $27,500 | 90 | $9,167 | +10.0% |
| Cycle 10% shorter | 150 | 20% | $25,000 | 81 | $9,259 | +11.1% |
| All four together | 165 | 22% | $27,500 | 81 | $12,324 | +47.9% |
Two things stand out. The levers multiply, so four modest gains add up to far more than any single one. And a shorter cycle helps slightly more than proportionally, because it divides rather than multiplies.
When the formula misleads
- Mixed segments. Blending a 30-day SMB motion with a 180-day enterprise motion produces a number that describes neither. Calculate velocity per segment.
- Period effects. Deals created this quarter often close next quarter. For win rate and cycle length, use cohorts (opportunities created in the same period) rather than whatever happened to close.
- It is a diagnostic, not a forecast. The formula assumes a steady state. Use it to find the constraint, and forecast from deal-level evidence.
How to measure each lever
Qualified opportunities
Count opportunities that met your written qualification criteria, either entering the period or open at its start, and apply the same rule every quarter. Opportunities created to hit an activity target inflate this lever and drag down win rate, so report opportunity count and win rate side by side.
Win rate
Divide won deals by all closed deals (won, lost and closed with no decision) that reached a fixed stage. Leaving out “no decision” outcomes flatters the number and hides the most common enterprise loss. Track count-based and value-based win rate separately; a team can win more small deals while losing the large ones.
Average deal size
Divide won revenue by the number of won deals, using one definition of value (annual contract value or first-year value) throughout. Report the median next to the mean so a single large deal does not hide a trend, and watch discount depth as a separate metric.
Sales cycle length
Measure the median days from qualification (or opportunity creation, if that is all you track reliably) to closed-won. Also track median time in each stage and median time to a loss: deals you lose after five months cost far more selling time than deals you lose in week three.
Deal velocity vs win rate: where the trade-offs are
The four levers are not independent. Pushing one often moves another, which is why velocity is a better target than any single input. Using the hypothetical baseline above:
- Stricter qualification. Suppose tighter entry criteria cut opportunities by 20% to 120 but lift win rate from 20% to 26%. Velocity rises to $8,667 per day (+4%), and reps work 30 fewer deals. A small velocity gain with much less wasted effort is usually a good trade.
- Discounting to pull deals forward. Suppose a quarter-end discount cuts average deal size by 10% and shortens the cycle by 5%. Velocity falls to $7,895 per day (−5.3%), and buyers learn to wait for the end of the quarter.
- Bigger deals take longer. Raising deal size by moving upmarket usually lengthens the cycle. In Ebsta and Pavilion’s 2023 B2B Sales Benchmark Report (3.2 million opportunities from 364 companies, 2022 data), the optimal close window was 31-60 days for small deals, 61-90 days for medium deals and 150-180 days for enterprise deals.
- Multithreading does not have to slow you down. In the same report, medium-sized deals with 7-9 relationships had a 48% win rate, 39% higher than deals with 4-6, and closed 10% quicker. Enterprise deals peaked at a 42% win rate with 10-12 relationships. These are correlations in one vendor’s dataset, but they cut against the idea that adding stakeholders always slows a deal. See multithreading for the practice itself.
Which matters more? Neither on its own. A team can raise win rate by working only sure deals and starve the pipeline, or shorten cycles by discounting and shrink revenue. Set targets on velocity per segment, and review the four inputs together so a gain in one is not paid for by another.
What slows enterprise deals?
Published research points to the same few causes. Most are about how buyers decide, not how fast sellers work.
Larger buying groups and harder consensus
Forrester’s State of Business Buying 2024 (4 December 2024) reports that 13 people are involved in the average buying decision, 89% of purchases involve two or more departments and 86% of B2B purchases stall during the buying process. Ebsta’s 2024 B2B Sales Benchmarks: H1 Update (analysis of $57 billion in revenue) found that the number of stakeholders involved grew from 5 to 8, and that sales cycles grew 20% compared with 2023.
Indecision, not only competitors
In an interview with CustomerThink (12 October 2022), Matt Dixon described research behind The JOLT Effect that analyzed about 2.5 million recorded sales conversations and found that 40-60% of deals are lost because the customer does nothing. He reported that preference for the status quo explains less than half of those losses; the larger share comes from buyers’ fear of making a mistake. Velocity work that only adds urgency misses this; reducing perceived risk (a clear recommendation, a limited set of options, a staged rollout) addresses it.
Buying is complex for the buyer too
Gartner’s Customer Confidence research page (undated, accessed 16 October 2026) reports that 77% of B2B buyers described their latest purchase as very complex or difficult, and that buyers spend about two-thirds of the journey gathering, processing and reconciling information.
Executives and finance engaged too late
Ebsta’s 2024 H1 update reports that win rates are 42% lower when the C-suite is engaged late, that win rates fall 64% when ROI is discussed late in the deal, and that top performers are 241% more likely to have the economic buyer engaged before the solution is presented. These are vendor-dataset correlations, but the direction is consistent: late discovery of who signs and why slows deals and loses them.
Security, legal and procurement steps
In Conveyor’s B2B SaaS Customer Trust Benchmark (undated vendor survey of 100+ security and compliance professionals), nearly 80% said security questionnaires are important or critical for closing deals. When these reviews start only after the buyer has chosen you, they add weeks at the end of the cycle; started during evaluation, they run in parallel.
Poor-fit opportunities entering the pipeline
Ebsta’s 2024 H1 update also reports that win rates increase 3.1x when opportunities match the ideal customer profile. Opportunities that should never have been qualified take up rep time and stretch average cycle length before they are finally lost.
In your own pipeline, these causes show up in three places: poor-fit deals entering early stages, qualified deals stalling mid-cycle without a buyer-side next step, and late-stage surprises from procurement, legal or an unseen stakeholder. Audit each separately.
B2B sales velocity benchmarks: what named sources report
There is no credible universal benchmark for sales velocity itself. It is revenue per day, so it scales with team size and price point; a “good” figure for one company is meaningless for another. Benchmark against your own trailing quarters, by segment. Published benchmarks do exist for the inputs:
| Benchmark | Figure | Source | Caveat |
|---|---|---|---|
| Optimal close window by deal size | 31-60 days (small), 61-90 days (medium), 150-180 days (enterprise) | Ebsta and Pavilion, 2023 | 2022 data; vendor dataset of 3.2M opportunities |
| Chance of closing for deals open longer than twice the average cycle | 3% | Ebsta and Pavilion, 2023 | 2022 data |
| Win rate at the most effective number of relationships | 42% enterprise (10-12), 48% medium (7-9), 29% small (1-3) | Ebsta and Pavilion, 2023 | Correlation; 2022 data |
| Change in 2024 vs 2023 | Sales cycles +20%, win rates −7%, rep velocity −15% | Ebsta, 2024 H1 Update | Ebsta does not publish its velocity definition in the update |
| Deal slippage (close date missed) | 37% of deals in 2022; 46% in Q1 2024, falling to 34% | Ebsta and Pavilion, 2023; Ebsta, 2024 | Vendor datasets |
| Buying cycle length reported by buyers | 87% of buyers (65% of enterprise buyers) completed their purchase within six months | TrustRadius and Pavilion, 2024 | Survey of 2,164 technology buyers; self-reported |
| Proposal stage speed | Opened 34 minutes after sending; 2.5 days from opening to closed-won; 34% average close rate | Proposify, State of Proposals 2026 | 742,137 proposals in 2025; average won deal $16,388, far smaller than most enterprise deals |
Use these as reference points, not targets. If your enterprise cycle is well past 180 days, the Ebsta window suggests checking for stalled deals that should be closed out; it does not mean your process is broken.
Deal velocity metrics to track
| Metric | How to calculate | What it tells you | Watch out for |
|---|---|---|---|
| Sales velocity | (Qualified opportunities × win rate × average deal size) ÷ cycle days | Revenue per day from the pipeline | Mixing segments with different cycles |
| Stage conversion rate | Opportunities moving to the next stage ÷ opportunities entering the stage | Where deals leak | Stage definitions changing mid-year |
| Median time in stage | Median days spent in each stage | Where deals wait | Averages skewed by abandoned deals |
| Sales cycle length | Median days from qualification to closed-won | Elapsed time to revenue | Inconsistent start dates |
| Time to loss | Median days from qualification to closed-lost | Selling time spent on deals you lose | Deals left open instead of closed out |
| Win rate | Won ÷ (won + lost + no decision) | Conversion quality | Excluding no-decision outcomes |
| No-decision rate | Deals closed with no vendor chosen ÷ all closed deals | Buyer indecision | Needs its own loss reason in the CRM |
| Average and median deal size | Won value ÷ won deals | Value per win | Discount creep |
| Close-date slippage rate | Deals whose close date moved out of the period ÷ deals forecast in the period | Momentum and forecast risk | Repeated small pushes |
| Stakeholder coverage | Engaged buyer contacts per opportunity, by role | Multithreading | Counting contacts who never respond |
| Mutual action plan on-time rate | Plan tasks completed by due date ÷ tasks due | Buyer commitment | Plans nobody updates |
| Days since last two-way buyer activity | Days since the buyer last replied, met or completed a task | Stall risk on a live deal | Counting one-way seller emails |
A mutual action plan makes two of these measurable that usually are not: buyer-side commitments and their due dates.
How AI and deal signals help deal velocity
The evidence on AI and sales outcomes is mostly survey-based. In a Gartner survey of 1,026 B2B sellers (published 16 September 2024), sellers who effectively partner with AI tools were 3.7 times more likely to meet quota. That is an association in self-reported data, and it does not show that AI shortened cycles. The same survey found that 50% of sellers feel overwhelmed by the amount of technology they need, and that overwhelmed sellers are 45% less likely to attain quota, so adding tools can work against you.
Buyers are using AI too: 45% of B2B buyers in a Gartner survey published 9 March 2026 said they used AI during a recent purchase. That raises the cost of inconsistent or out-of-date seller material.
Where AI and deal signals do help is in catching slowdowns earlier than a weekly review would:
- Stall detection: flagging deals with no two-way buyer activity, repeated close-date pushes or overdue plan tasks.
- Evidence checks before stage changes: is the economic buyer identified, is the decision process documented, has security review started?
- Coverage gaps: showing which roles in the buying group have not engaged.
- Content by stage and role: suggesting the asset that answers the buyer’s next question.
- Win-loss patterns: finding what stalled and lost deals had in common, from calls and CRM history.
AI playbooks for deal velocity
A velocity playbook turns each signal into an agreed action, so alerts lead to a change rather than noise. Examples:
- No two-way buyer activity for a week and no meeting booked: the manager asks the rep for the buyer-side next step and its owner.
- Finance viewed pricing but no business case exists: the rep shares a business case summary with the champion.
- Security documents unopened two weeks before the target signature date: the rep escalates the security review in the mutual action plan.
- Close date pushed twice: the deal is re-qualified on decision process and compelling event before it stays in the forecast.
The limits are real. Signals are only as good as CRM and activity data. AI cannot create urgency the buyer does not have, and it cannot fix indecision on its own. Treat alerts as coaching questions, not forecast verdicts; our post on AI deal coaching and deal-risk signals covers how to design them. Revspire’s Digital Sales Rooms provide mutual action plans with owners and due dates, stakeholder mapping and buyer engagement analytics, and its AI Playbook Engine includes AI win-loss analysis of deals and calls.
A 90-day plan to improve deal velocity
- Weeks 1-2: baseline. Pull two to four quarters of closed opportunities. Calculate the four inputs and median time in stage per segment, using cohorts.
- Week 3: find the constraint. Compare each lever with its own trend and with your best-performing segment or team. Pick the one with the largest gap.
- Week 4: choose two or three changes aimed at that constraint, each with one owner and one measure. Examples: written exit criteria for the qualification stage, a mutual action plan on every deal above a set size, or an economic buyer meeting before any proposal.
- Weeks 5-12: run it weekly. Review stalled deals by signal in the pipeline meeting, and decide the next buyer-side step for each.
- Day 90: compare with the baseline. Keep, revise or stop each change. Note anything else that changed in the period, such as pricing, territories or seasonality, before crediting the result to one change. Feed findings into your win-loss analysis.
To make buyer-side steps and dates visible from the first week, start with Revspire’s free mutual action plan template.
Frequently asked questions
How do you calculate deal velocity?
Multiply the number of qualified opportunities by win rate and average deal size, then divide by the average sales cycle length in days. The result is revenue per day. For example, 150 opportunities × 20% × $25,000 ÷ 90 days is about $8,333 per day (hypothetical figures).
What is a good sales velocity for a B2B team?
There is no universal benchmark, because velocity scales with team size and price. Compare against your own trailing quarters by segment. For the inputs, Ebsta and Pavilion’s 2023 report put the optimal close window at 61-90 days for medium deals and 150-180 days for enterprise deals, based on 2022 data.
What is the difference between sales velocity and pipeline velocity?
Most teams use the terms interchangeably for the same formula: revenue the pipeline produces per day. Some use pipeline velocity for how quickly opportunities move between stages. Define the term once in your reporting and use it consistently.
How do case studies impact enterprise deal velocity?
We found no published study that isolates the effect of case studies on enterprise deal velocity. You can test it in your own data: compare stage conversion and time in stage for similar deals where a matched case study or reference was shared at the evaluation or business case stage versus deals where it was not. Peer proof is most likely to help where indecision, rather than competition, is slowing the deal.
Which matters more, deal velocity or win rate?
Velocity, because it includes win rate along with opportunity volume, deal size and cycle length. Optimizing win rate alone can shrink the pipeline, and optimizing speed alone can lead to discounting. Track the four inputs together.
Sources
All pages were accessed on 16 October 2026.
- How to Supercharge Your Sales Velocity for Quicker Wins, Salesforce, 12 March 2024
- 2023 B2B Sales Benchmark Report, Ebsta and Pavilion, 2023 (2022 data)
- 2024 B2B Sales Benchmarks: H1 Update, Ebsta, 2024
- To Master B2B Buying Mayhem, Providers Must Prioritize Buyers’ Needs (State of Business Buying 2024), Forrester, 4 December 2024
- The problem of customer indecision and how to get over it: interview with Matt Dixon, CustomerThink, 12 October 2022
- Customer Confidence, Gartner, undated
- B2B SaaS Customer Trust Benchmark Report, Conveyor, undated
- TrustRadius and Pavilion reveal 2024 B2B buying trends, MarTech Series, 2024
- State of Proposals 2026, Proposify, 2026
- Gartner Sales Survey Reveals Sellers Who Partner With AI Are 3.7 Times More Likely to Meet Quota, Gartner, 16 September 2024
- Gartner Sales Survey Finds 67% of B2B Buyers Prefer a Rep-Free Experience, Gartner, 9 March 2026
Leave a Reply